Results from EPIC
Please select first the parameters of your run and then click on 'Run EPIC'.
Main input parameters have changed. Please click on 'Run EPIC' to compute the new cell fractions.
Please select first the parameters of your run and then click on 'Run EPIC'.
Main input parameters have changed. Please click on 'Run EPIC' to compute the new cell fractions.
A description of EPIC method is found in the about page tab .
This help page describes how to use EPIC 's web application.
The main app window is showed below.
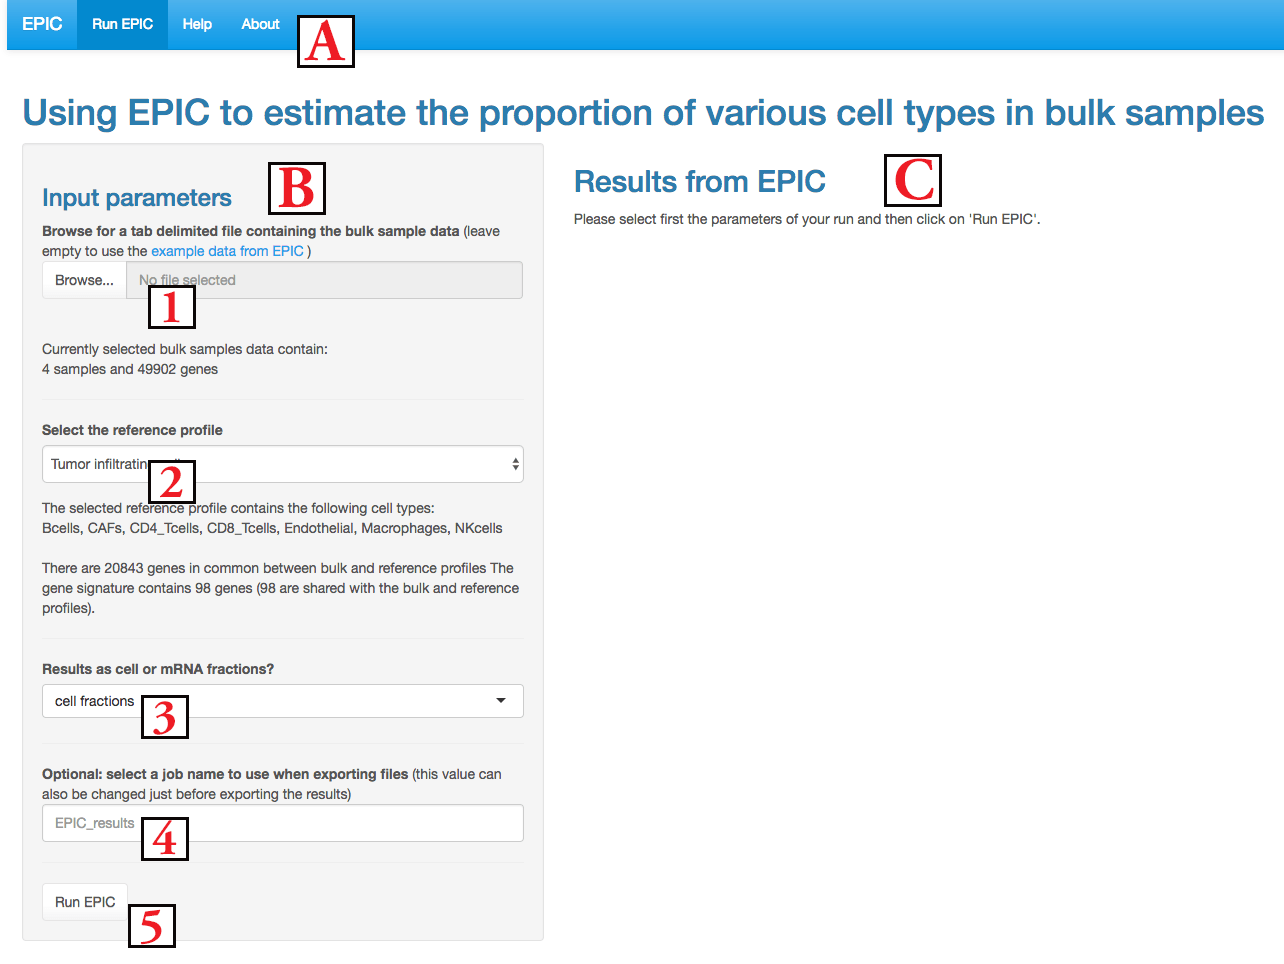
It is composed of 3 regions : (A) the menu to navigate between the application and information pages; (B) the input parameters area and (C) the results area. We describe below the inputs and then the results.
In order to launch EPIC , you need to (1) upload some bulk gene expression samples, (2) select which reference profiles to use, (3) decide whether results should be given as cell fractions or mRNA fractions, (4) optionally give some name to your job for the file downloads and (5) then click on Run EPIC to launch the computations (it takes some seconds or minutes depending on the number of samples and genes).
Further details on these options are given below.
The bulk gene expression samples need to be given as a
tab-delimited text file
(not comma-separated csv or other
format). The maximum size of this file is 100 MB (if bigger size is
needed, you can either split your samples between multiple files or use
the
R-package from EPIC
). The first column gives
the gene names (use the official gene symbols when using the prebuilt
reference profiles - e.g.
CD8A, MS4A1,
... -
Note:
it is advised to keep all genes in this file instead of a subset of
signature genes).
The other columns give the gene expression from
each sample (these counts should be given in transcripts per million
(TPM) or reads/fragments per kilobase per million mapped reads (RPKM/FPKM)).
Columns headers give the name of each sample. An example file can be
downloaded from
here
.
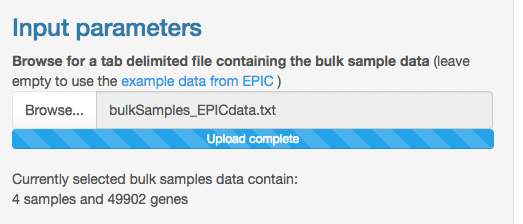
Once your bulk samples data is uploaded, some text shows how many
samples and genes are present in this file.
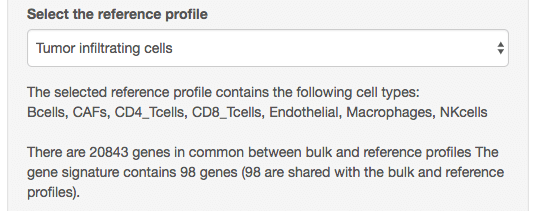
The next step is to select the reference gene expression profiles. You
can either use some prebuilt references profiles (see the accompanying
publication referenced in the
about page tab
) derived from blood circulating immune cells or from tumor
infiltrating cells (including immunes cells but also stromal and
endothelial cells), or you can upload your own reference profiles.
Under the selected profile, some text indicates which cell types are present in this profile (note that EPIC will also predict the proportion from an additional cell type for which no reference profile was provided). Some other text gives information about the number of genes that could be matched between the reference profiles and the bulk samples.
If you decide to use your own gene expression reference profiles,
two other file upload boxes will appear:
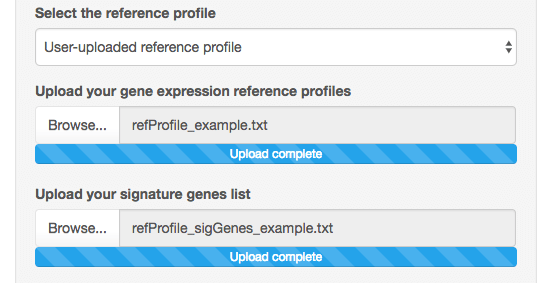
The first one is to upload your reference profile matrix. This is again
some tab-delimited file, containing the gene names in the first column
(it could be any type of name (gene name, ensembl ID, ...), as long
as it is the same type of names than in the bulk data). The other
columns give for each cell type its reference profile expression
(counts in TPM, RPKM, FPKM or it is possible to also have both the bulk
data and reference profiles given in raw counts; but these counts
should never be in log scale). In addition to these columns, one
can optionally have additional columns giving the gene expression
variability for each cell type - these are given by appending to the
cell type name a string '.var', e.g. you could have the columns
geneName, Bcells, Bcells.var, Tcells, Tcells.var
in order to define the reference profiles and variability for B cells
and T cells (if you define the variability in gene expression, it
is needed to have this information for each cell type). Note that the
order of the columns except for the first one are not important. An
example reference profile
file is available here
.
When defining your own gene expression reference profiles, you also
need to define a list of cell signature genes to use by
EPIC
. These signature genes do not need to be expressed by only one cell
type, but they should at least be expressed only by the cell types for
which reference profiles are given. The list of genes can either be
given as one gene per line or as genes separated by space or comma like
in
this example list
.
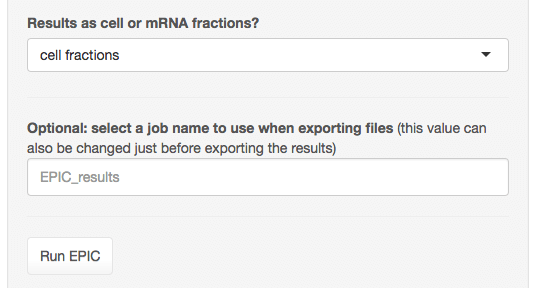
The next parameter is to decide if results should be showed as cell
fraction or mRNA fractions. These two fractions are not the same as
some cell types express more mRNA copies per cell than some other cell
types (see the accompanying publication referenced in the
about page tab
). Currently, mRNA per cell
values are available for the main immune cell types and average values
are used for the other cell types. Note that this option can also be
changed after running
EPIC
, the results will not need to be
re-computed as both values are stored during the run.
The last parameter is an optional job name that is used in the figure titles and file names if you download the results.
After running
EPIC
, the
results area
(C)
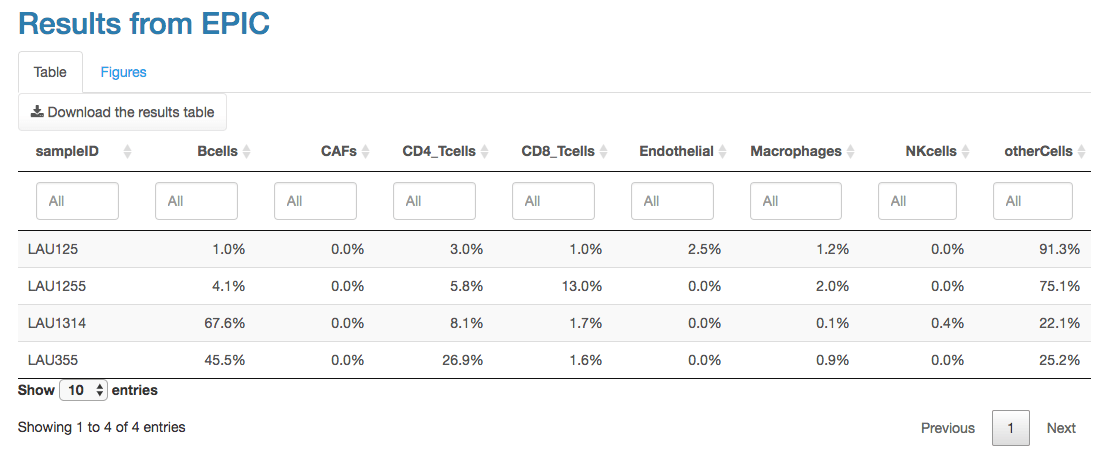
is composed of two panels. The first panel shows a table of the results,
with the proportions from each cell type in each sample. This table can
also be downloaded as a tab-delimited file.
The second panel shows the results with multiple figures. These figures
can also be downloaded as a
pdf
file.
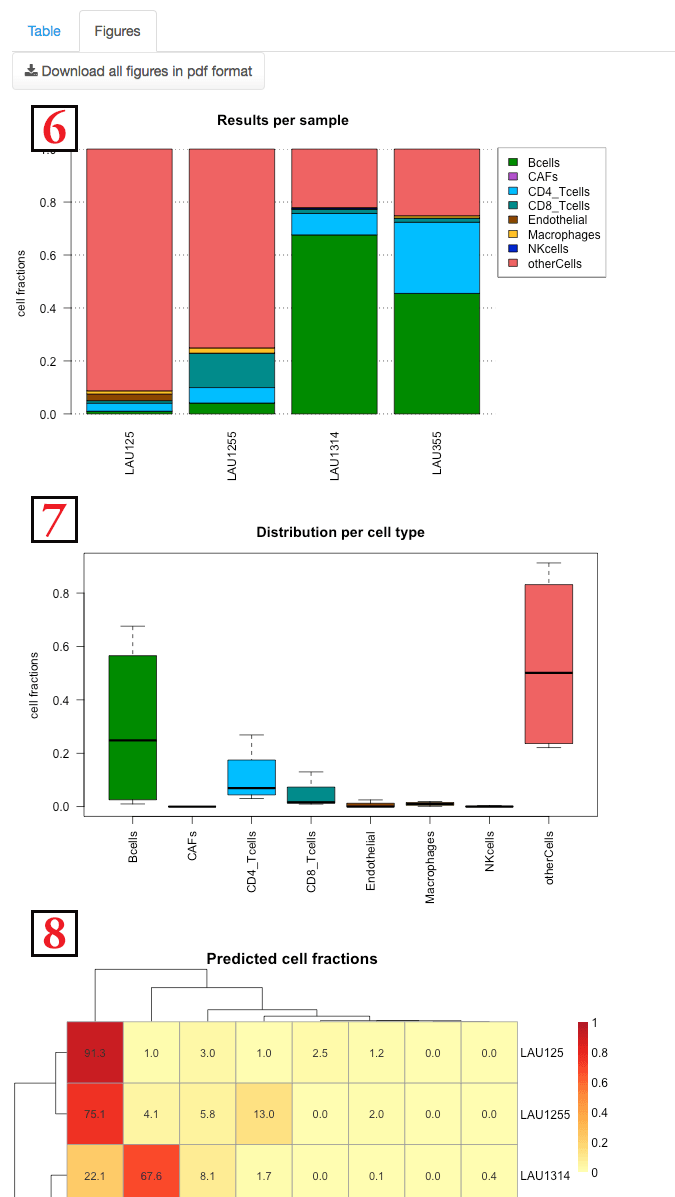
Figure
(6)
shows the composition of each sample separately.
Figure
(7)
shows the distribution of each cell type among
the various samples.
Figure
(8)
is a heatmap detailing the fraction of
each cell type in each samples. A clustering both on the cell types
and samples is done.
This happens in general when there is an issue with some input file
you uploaded.
Please double-check the file format - more
details are available in the
help page
.
EPIC is returning two proportion values:
mRNAProportions
and
cellFractions
where the 2nd represents the true proportion of cells coming from the different
cell types when considering differences in mRNA expression between cell types.
So in principle, it is best to consider these
cellFractions
.
However, please note, that when the goal is to benchmark EPIC predictions, if
the 'bulk samples' correspond in fact to in silico samples reconstructed for
example from single-cell RNA-seq data, then it is usually better to compare the
'true' proportions against the
mRNAProportions
from EPIC. Indeed, when
building such in silico samples, the fact that different cell types express
different amount of mRNA is usually not taken into account. On the other side,
if working with true bulk samples, then you should compare the true cell
proportions (measured e.g., by FACS) against the
cellFractions
.
EPIC predicts the proportions of the various cell types for which we have gene expression reference profiles (and corresponding gene signatures). But, depending on the bulk sample, it is possible that some other cell types are present for which we don't have any reference profile. EPIC returns the proportion of these remaining cells under the name 'other cells'. In the case of tumor samples, most of these other cells would certainly correspond to the cancer cells, but it could be that there are also some stromal cells or epithelial cells for example.
As described in our manuscript, EPIC first estimates the proportion of mRNA
per cell type in the bulk and then it uses the fact that some cell types have
more mRNA copies per cell than other to normalize this and obtain an estimate of
the proportion of cells instead of mRNA (EPIC function returns both information
if you need the one or the other). For this normalization we had either measured
the amount of mRNA per cell or found it in the literature (fig. 1 – fig.
supplement 2 of our paper). However we don’t currently have such values for the
endothelial cells and CAFs. Therefore for these two cell types, we use an average
value, which might not reflect their true value and this could bias a bit the
predictions, especially for these cell types. If you have some values for these
mRNA/cell abundances, you
can use the R-package of EPIC to set these values (not available in the
web application).
If the mRNA proportions of these cell types are low, then even if you don't
correct the results with their true mRNA/cell abundances, it would not really
have a big impact on the results. On the other side, if there are many of these
cells in your bulk sample, the results might be a little bit biased, but the
effect should be similar for all samples and thus not have a too big importance
(maybe you wouldn’t be fully able to tell if there are more CAFs than Tcells for
example, but you should still have a good estimate of which sample has more CAFs
(or Tcells) than which other sample for example).
When estimating the cell proportions EPIC performs a least square
regression between the observed expression of the signature genes and
the expression of these genes predicted based on the estimated
proportions and gene expression reference profiles of the various cell
types. When such a warning message appears, it means that the
optimization didn’t manage to fully converge for this regression, for
the samples indicated. Such cases usually happen
when the maximum number of iterations has been reached in the
optimization, meaning there is possibly an issue with the bulk gene
expression data that maybe don’t completely follow the assumption of
equation (1) from our manuscript. From our experience, it seems in
practice that even when there was such a warning message the proportions
were predicted well, it is maybe that the optimization just wants to be
too precise,
or maybe few of the signature genes didn’t
match well but the rest of signature genes could be used to have a
good estimate of the proportions.
If you have some samples that seem to have strange results, it could
however be useful to check that the issue is not that these samples
didn’t converge well. To be more conservative you could also remove all
the samples that didn't converge well as these are maybe outliers, if
it is only a small fraction from your original samples.
Julien Racle ( julien.racle@unil.ch ). Please provide as much details as possible and ideally send also an example input file (and/or reference profiles) that is causing the issue.
EPIC application is designed to Estimate the Proportion of Immune and Cancer cells from bulk tumor gene expression data. This is done by fitting gene expression reference profiles from the main non-malignant cell types and simultaneously accounting for an uncharacterized cell type without prior knowledge about it (e.g. cancer cells in solid tumors samples). We derived reference gene expression profiles from the main tumor infiltrating cell types (i.e. immune subsets, stromal and endothelial cells). This method could however also be applied to predict the cell fractions in other types of mixed samples if reference gene expression profiles from these other cell types are available.
All the details about this method are available in
Racle, J., Jonge, K. de, Baumgaertner, P., Speiser, D.E., and
Gfeller, D. (2017). Simultaneous enumeration of cancer and immune cell
types from bulk tumor gene expression data.
eLife, 6,
e26476. (
https://elifesciences.org/articles/26476
).
EPIC is also available as an R -package ( https://github.com/GfellerLab/EPIC ), containing some advanced options. Release version 1.1 of the package is used in this web-application.
This application and the R -package have been developed by Julien Racle from the David Gfeller's group at the Ludwig Center for Cancer Research of the University of Lausanne ( https://www.unil.ch/dof/research/gfeller ).
A pyhton wrapper for EPIC has been written by Stephen C. Van Nostrand from MIT and is available at https://github.com/scvannost/epicpy .
EPIC can be used freely by academic groups for non-commercial purposes. The product is provided free of charge, and, therefore, on an " as is " basis, without warranty of any kind.
If you plan to use EPIC (version 1.1) in any for-profit application,
you are required to obtain a separate license.
To do so, please contact Nadette Bulgin (
nbulgin@lcr.org
) at the Ludwig Institute for Cancer Research Ltd.